
![]() At airdump.net there are altogether pentest and security tutorials. This text will reflex who to after securing oneselfs installation get the overview what is happening in the system. There is a lot of tricks. We will demonstrate how to do it easily and all together. The text was created to show way of GUI monitoring, mainly firewall and network events. Speaking generally the configuration possibilities are much more wider. Read more..
At airdump.net there are altogether pentest and security tutorials. This text will reflex who to after securing oneselfs installation get the overview what is happening in the system. There is a lot of tricks. We will demonstrate how to do it easily and all together. The text was created to show way of GUI monitoring, mainly firewall and network events. Speaking generally the configuration possibilities are much more wider. Read more..
Easy and well arranged
There is a lot of commands (czech language) in the linux systems and by console there can be controled and monitored the whole system. But there is a quite useful tool that concentrates and applicates the power of the shell on one place. Correctly configurated firewall and strict rules are useless when there is a code in the system that uses open ports and works from the inside.
Conky
A lot of us know this application. It is defaultly installated even in a distribution such as Backtrack. There is not much to fing in the basic configuratin. We will demonstrate how to configurate the application and by a small tweak accept the firehol, log events into extra log. Then feature them by conky monitor at Desktop and make them able to read. The configuration includes even the real-time featuring the incoming and outgoing connection.
Ulogd
A simple installation is enough and you don’t have to bother anymore. According to the system version..
slapt-get --install ulogd
apt-get install ulogd
Or download source code and compile 🙂
Firehol
Into the configurated file firehol add a row
FIREHOL_LOG_MODE="ULOG"
Entire configuration
Instead of writing what is what I will share my own conkyrc configuration. This will anyway have to be modified (particulary in case of disk and network interface configuration) So you won’t miss a training of your skills 🙂
# A comprehensive conky script, configured for use on
# Ubuntu / Debian Gnome, without the need for any external scripts.
#
# Based on conky-jc and the default .conkyrc.
# INCLUDES:
# – tail of /var/log/messages
# – netstat connections to your computer
#
# — Pengo ([email protected])
#
#
# Create own window instead of using desktop (required in nautilus)
own_window yes
own_window_type override
own_window_transparent yes
own_window_hints undecorated,below,sticky,skip_taskbar,skip_pager
#
# Use double buffering (reduces flicker, may not work for everyone)
double_buffer yes
#
# fiddle with window
use_spacer no
#
# anti-aliasing
use_xft no
#
# Xft font when Xft is enabled
# xftfont arial:pixelsize=8
#
# Text alpha when using Xft
# xftalpha 0.8
#
# Update interval in seconds
update_interval 3
#
# Minimum size of text area
# minimum_size 250 5
maximum_width 300
#
# Draw shades?
draw_shades yes
#
# Text stuff
draw_outline yes # amplifies text if yes
draw_borders no
font arial:pixelsize=11
uppercase no # set to yes if you want all text to be in uppercase
#
# Force UTF8? note that UTF8 support required XFT
# override_utf8_locale yes
#
# Stippled borders?
stippled_borders 3
#
# border margins
border_margin 9
#
# border width
border_width 10
#
# Default colors and also border colors, grey90 == #e5e5e5
default_color grey90
#
own_window_colour brown
own_window_transparent yes
#
# Text alignment, other possible values are commented
#alignment top_left
alignment top_right
#alignment bottom_left
#alignment bottom_right
#
# Gap between borders of screen and text
gap_x 5
gap_y 40
#
# stuff after ‘TEXT’ will be formatted on screen
#
TEXT
$color
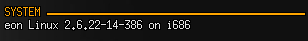
${color orange}SYSTEM ${hr 2}$color
$nodename $sysname $kernel on $machine
#
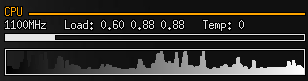
${color orange}CPU ${hr 2}$color
${freq}MHz Load: ${loadavg} Temp: ${acpitemp}
$cpubar
${cpugraph 000000 ffffff}
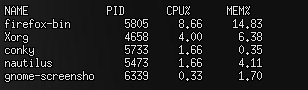
NAME PID CPU% MEM%
${top name 1} ${top pid 1} ${top cpu 1} ${top mem 1}
${top name 2} ${top pid 2} ${top cpu 2} ${top mem 2}
${top name 3} ${top pid 3} ${top cpu 3} ${top mem 3}
${top name 4} ${top pid 4} ${top cpu 4} ${top mem 4}
${top name 5} ${top pid 5} ${top cpu 5} ${top mem 5}
#
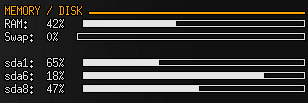
${color orange}MEMORY / DISK ${hr 2}$color
RAM: $memperc% ${membar 6}$color
Swap: $swapperc% ${swapbar 6}$color
#
sda1: ${fs_free_perc /media/sda1}% ${fs_bar 6 /media/sda1}$color
sda6: ${fs_free_perc /media/sda6}% ${fs_bar 6 /media/sda6}$color
sda8: ${fs_free_perc /media/sda7}% ${fs_bar 6 /media/sda7}$color
#
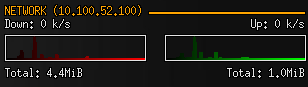
${color orange}NETWORK (${addr ath0}) ${hr 2}$color
Down: $color${downspeed ath0} k/s ${alignr}Up: ${upspeed ath0} k/s
${downspeedgraph ath0 25,140 000000 ff0000} ${alignr}${upspeedgraph ath0
25,140 000000 00ff00}$color
Total: ${totaldown ath0} ${alignr}Total: ${totalup ath0}
#
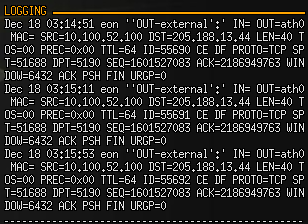
${color orange}LOGGING ${hr 2}$color
${execi 30 tail -n3 /var/log/ulog/syslogemu.log | fold -w50}
$stippled_hr
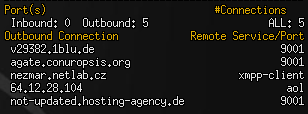
${color #ddaa00}Port(s)${alignr}#Connections
$color Inbound: ${tcp_portmon 1 32767 count} Outbound: ${tcp_portmon 32768 61000 count}${alignr}ALL: ${tcp_portmon 1 65535 count}
${color #ddaa00}Outbound Connection ${alignr} Remote Service/Port$color
${tcp_portmon 32768 61000 rhost 0} ${alignr} ${tcp_portmon 32768 61000 rservice 0}
${tcp_portmon 32768 61000 rhost 1} ${alignr} ${tcp_portmon 32768 61000 rservice 1}
${tcp_portmon 32768 61000 rhost 2} ${alignr} ${tcp_portmon 32768 61000 rservice 2}
${tcp_portmon 32768 61000 rhost 3} ${alignr} ${tcp_portmon 32768 61000 rservice 3}
${tcp_portmon 32768 61000 rhost 4} ${alignr} ${tcp_portmon 32768 61000 rservice 4}
${tcp_portmon 32768 61000 rhost 5} ${alignr} ${tcp_portmon 32768 61000 rservice 5}
${color #ddaa00}Inbound Connection ${alignr} Local Service/Port$color
${tcp_portmon 1 32767 rhost 0} ${alignr} ${tcp_portmon 1 32767 lservice 0}
${tcp_portmon 1 32767 rhost 1} ${alignr} ${tcp_portmon 1 32767 lservice 1}
${tcp_portmon 1 32767 rhost 2} ${alignr} ${tcp_portmon 1 32767 lservice 2}
${tcp_portmon 1 32767 rhost 3} ${alignr} ${tcp_portmon 1 32767 lservice 3}
${tcp_portmon 1 32767 rhost 4} ${alignr} ${tcp_portmon 1 32767 lservice 4}
${tcp_portmon 1 32767 rhost 5} ${alignr} ${tcp_portmon 1 32767 lservice 5}
Tweaking Configuration
According to your need you can take off or add random parts of configuration. I suggest to change just disk (sda) and network interface (ath0) labelling
Monitoring
Window size and the number of monitoring windows can be configurated. Conky in action looks little bit like this (the picture is divided into parts – normally it’s of a piece 🙂
System name
Monitoring CPU
List of running applications
Using memory list
Network traffic
Firewall Log
Outgoing connections
Similar Posts:
- IEEE ICC on Security Technology
- Capturing WPA-PSK handshake
- WLAN Hacking with WEPKR plug-in
- Aireplay-ng Packet Injection Windows CommView Hack
- WEP cracking Intel Centrino, OmniPeek + winAircrack
- Make your own video tutorial
- Abhinav Singh Metasploit Penetration Testing Cookbook
- XSS pentest plug in – Cross-Site Scripting
- Packet Injection wifi Intel 4965 AGN patch
- Essential Tools – Nessus exploit and rootkit scanner

